Introducing quantmod:
It is possible with one quantmod function to load data from a variety of sources, including...
- Yahoo! Finance (OHLC data)
- Federal Reserve Bank of St. Louis FRED® (11,000 economic series)
- Google Finance (OHLC data)
- Oanda, The Currency Site (FX and Metals)
- MySQL databases (Your local data)
- R binary formats (.RData and .rda)
- Comma Separated Value files (.csv)
- More to come including (RODBC,
economagic,Rbloomberg,...)
Getting data
> getSymbols("YHOO",src="google") # from google finance[1] "YHOO"
> getSymbols("GOOG",src="yahoo") # from yahoo finance
[1] "GOOG"
> getSymbols("DEXJPUS",src="FRED") # FX rates from FRED
[1] "DEXJPUS"
> getSymbols("XPT/USD",src="Oanda") # Platinum from Oanda
[1] "XPTUSD" Each call results in the data being loaded directly into your workspace, with the name of the object returned from the call. Sort of handy, but it gets better... > # Specify lookup parameters, and save for future sessions.
>
> setSymbolLookup(YHOO='google',GOOG='yahoo')
> setSymbolLookup(DEXJPUS='FRED')
> setSymbolLookup(XPTUSD=list(name="XPT/USD",src="oanda"))
> saveSymbolLookup(file="mysymbols.rda")
> # new sessions call loadSymbolLookup(file="mysymbols.rda")
>
> getSymbols(c("YHOO","GOOG","DEXJPUS","XPTUSD"))
[1] "YHOO" "GOOG" "DEXJPUS" "XPTUSD" Now it's easy to load data from different sources into your workspace (or any other environment) without explicitly requiring assignment, or constantly remembering/specifying connection parameters. Think of it as a load command that can fetch data from almost anywhere. Try it yourself gettingdata.R
Charting with quantmod
Now that we have some data we may want to look at it. Enter the new function chartSeries. At present this is a nice tool to visualize financial time series in a way that many practicioners are familiar with - line charts, as well as OHLC bar and candle charts. There are convenience wrappers to these different styles (lineChart,barChart, and candleChart), though chartSeries does quite a bit to automatically handle data in the most appropriate way.
A quick look at how to create some charts, including some features
and a look at what's coming in
future releases.
> # Specify lookup parameters, and save for future sessions.
>
> getSymbols("AAPL",src="yahoo")
[1] "AAPL"
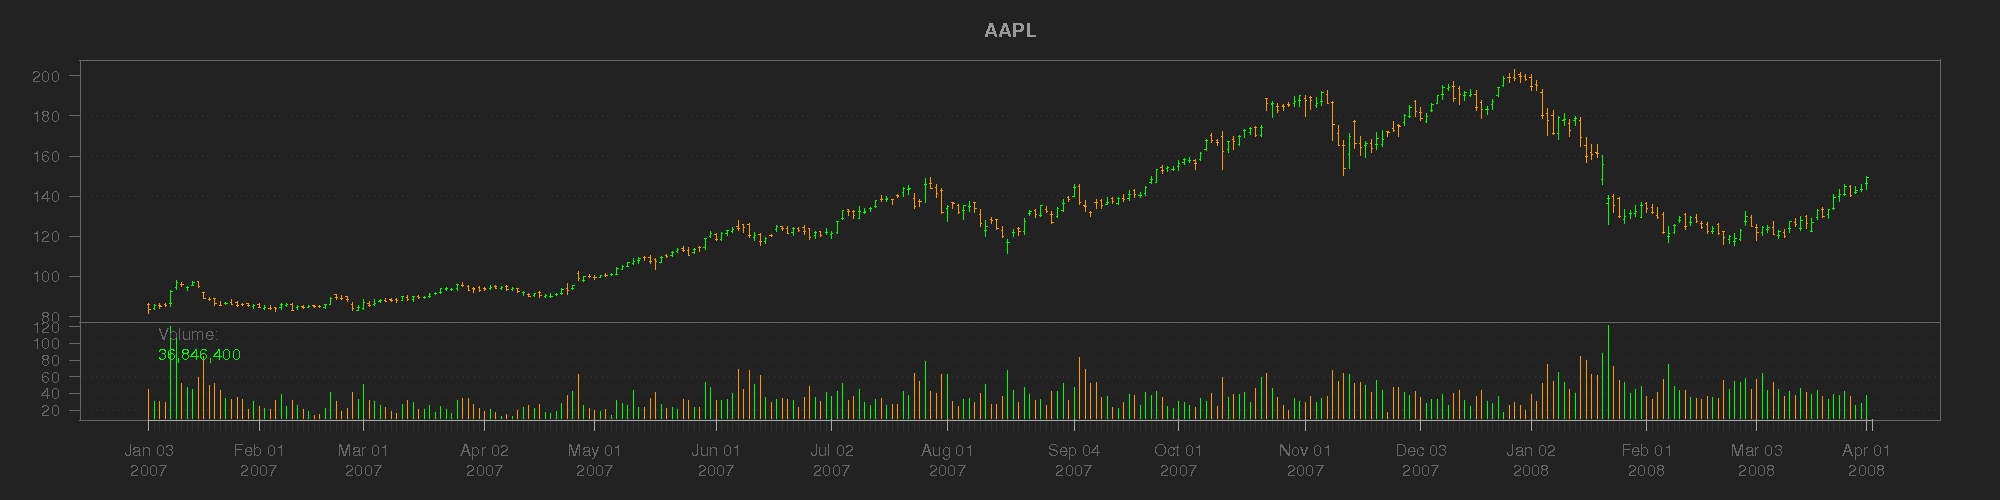
> barChart(AAPL)
Click to see the full chart:
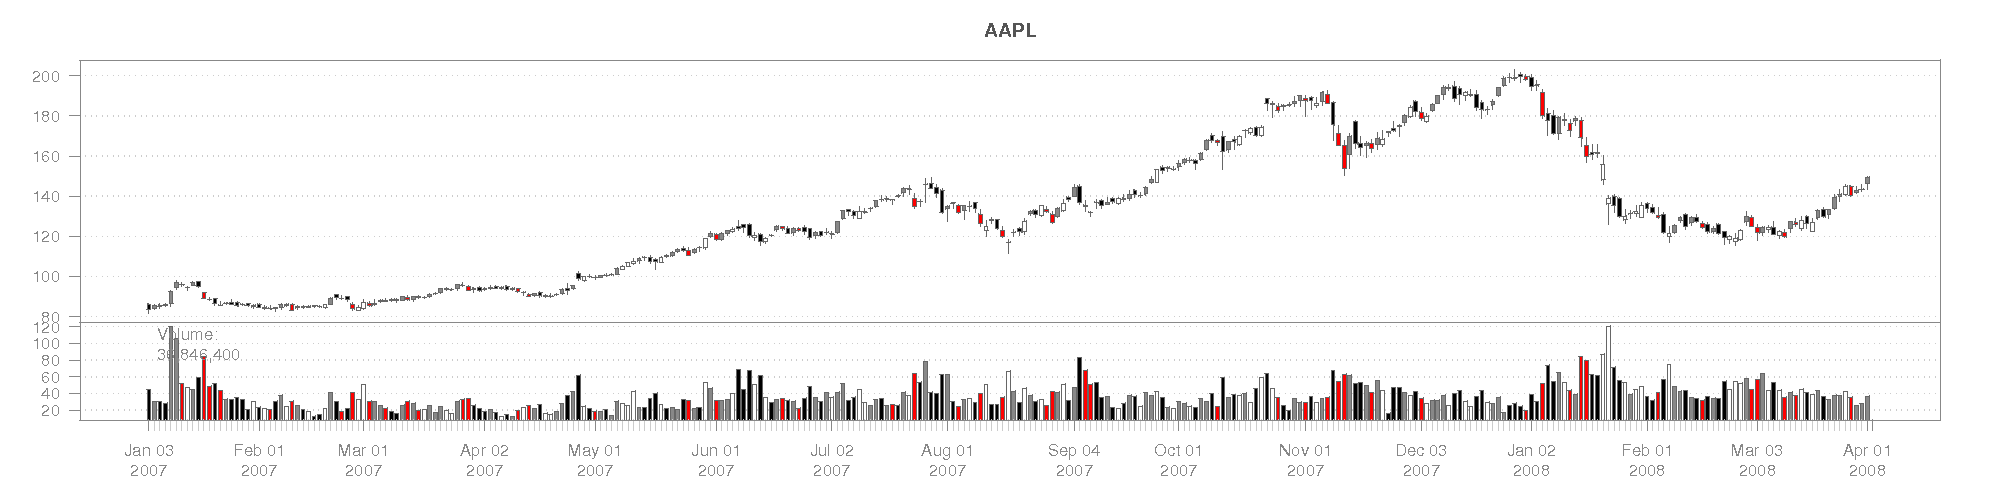
> # Add multi-coloring and change background to white
> candleChart(AAPL,multi.col=TRUE,theme="white")
Click to see the full chart:
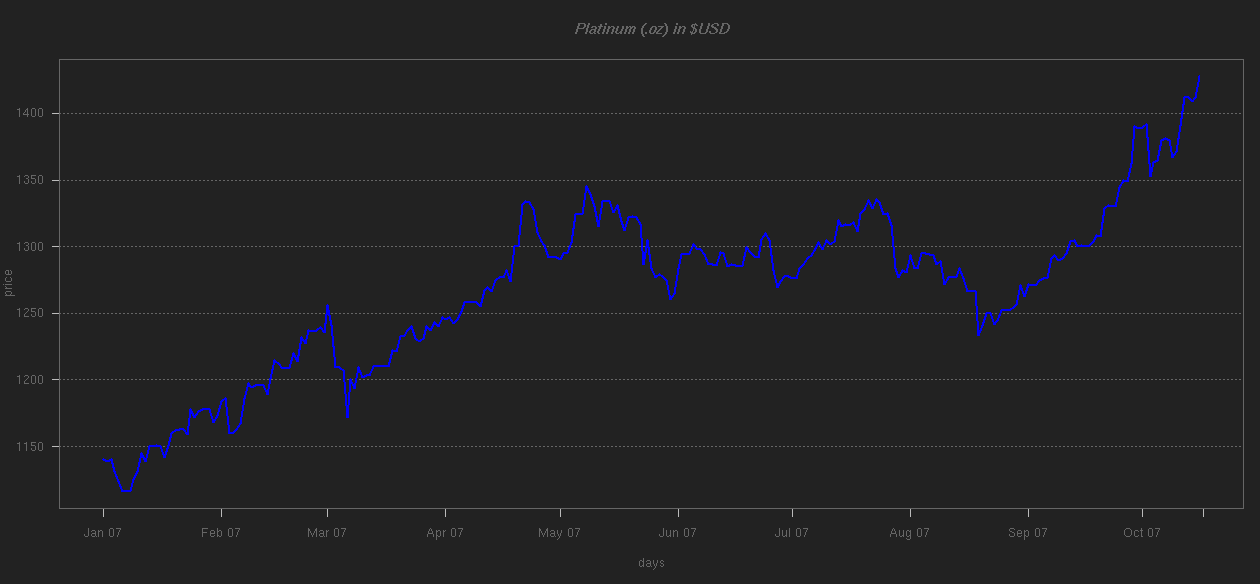
Non-OHLC and Volume series are handled automatically
> getSymbols("XPT/USD",src="oanda")
[1] "XPTUSD"
> chartSeries(XPTUSD,name="Platinum (.oz) in $USD")
Click to see the full chart:
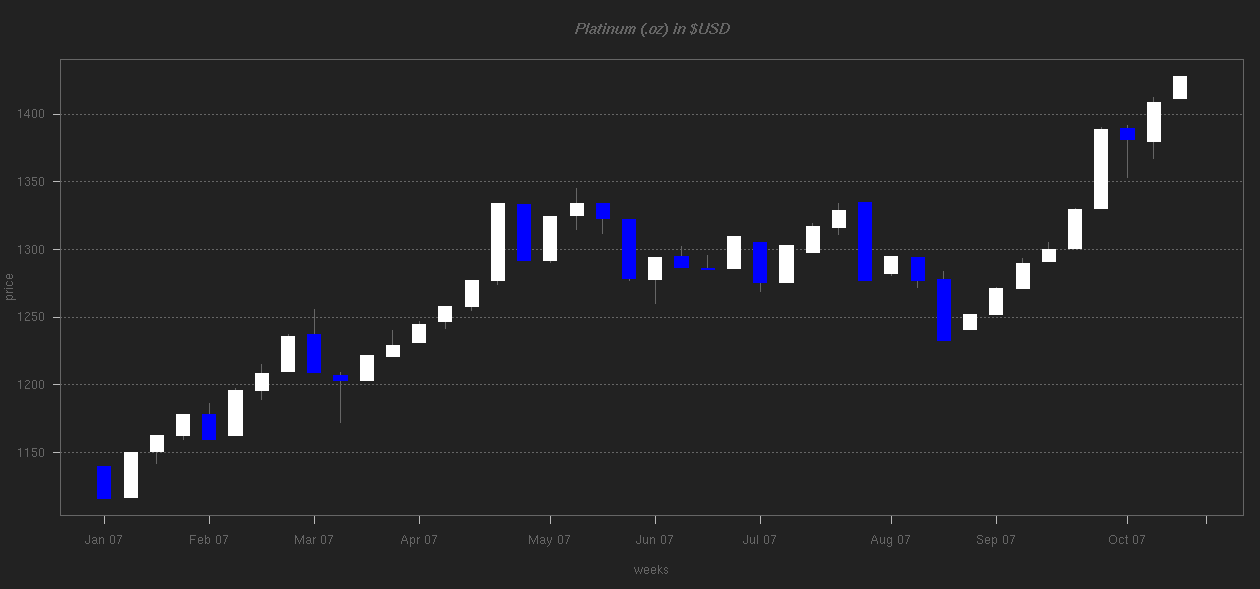
Platinum, now weekly with custom color candles
using the quantmod function to.weekly
> chartSeries(to.weekly(XPTUSD),up.col='white',dn.col='blue')
Click to see the full chart:
Try it yourself here: chartingwithquantmod.R
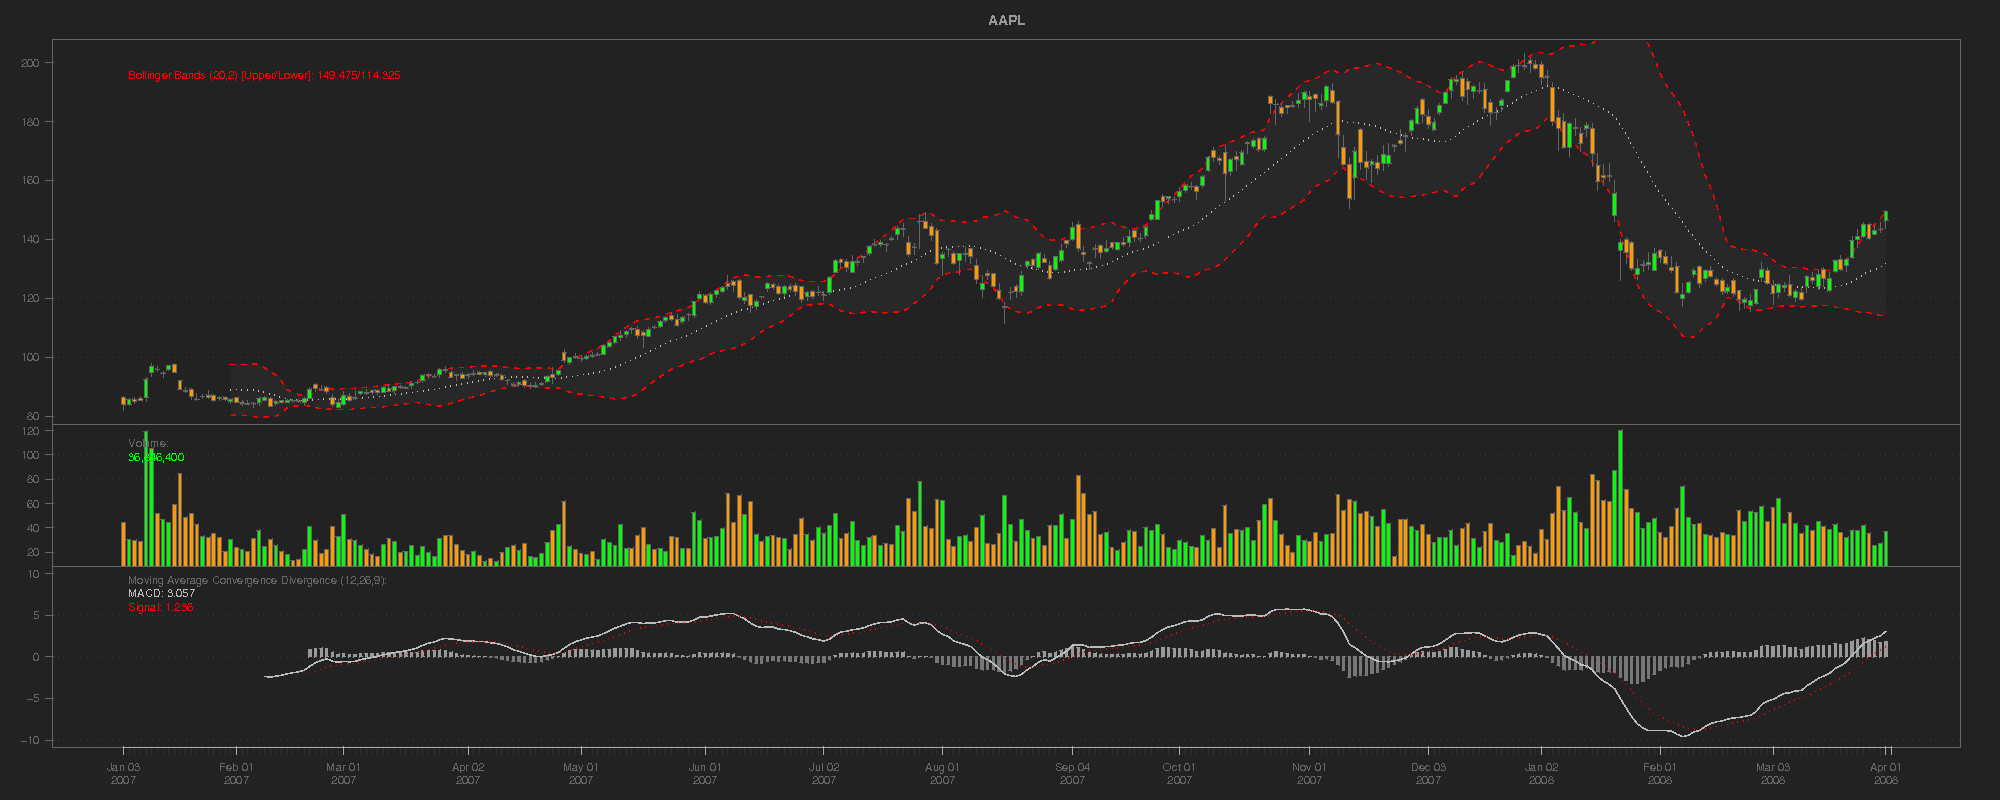
Technical analysis charting tools
As of version 0.3-0 one can now add technical analysis studies from package TTR to the above chart. A detailed examples page will follow shortly, but here is a bit of the goodness:Very nice technical functionality from the library by Josh Ulrich - on CRAN
> require(TTR)
> getSymbols("AAPL")
[1] "AAPL"
> chartSeries(AAPL)
> addMACD()
> addBBands()
Click to see the full chart:
Using the data to generate signals
Building models will mostly be left for a later example series, but for those eager to continue wasting a Friday afternoon at work (when most of my visitors seem to appear), I will continue.
Modelling in R is what R is about. Data feeds into this discussion most prevelently due to the fact that much financial data is not contained in single data objects. Much, if not all, has to collected and aggregated by you, the modeller.
This is where pre-specifying data sources and connection parameters comes in so handy. setSymbolLookup allows the modeller the opportunity to instruct quantmod to source data - given a specific symbol - in a particular manner. When building models in R, often a formula is passed to the fitting function along with the appropriate data object to search.
To handle many different sources it is necessary to either create a data object with all the columns prespecified, OR to use objects visible within the user's environment. Both have obvious drawbacks - not the least of which is a reliance on the modeller to have manually loaded and aligned the series in question.
At the very best this is time consuming and certainly not very enlightening. At its worst it can be dangerous as data handling is inherently error-prone. Data errors in research can be costly, data errors in trading can quickly lead to a new career. That said, I will reemphasize the terms of the LICENSE stating the COMPLETE LACK OF WARRANTY with regard to this software and all of R for that matter. User beware!
To facilitate this relatively unique data issue, quantmod dynamically creates data objects for use within the modelling process, creating a model frame internally after going through a series of steps to identify the sources of data required - loading if necessary. specifyModel is the workhorse function to handle all the data issues, and it's help file should be read to fully understand what is happening internally. For our purposes here, it is enough to know that one can specify ANY data within the call to specifyModel, and quantmod will handle to lookup and data aggregation for you. Of course the data has to be locatable and unique, but that was probably suspected.
Lets's take a look at an example of specifyModel:
> # Create a quantmod object for use in
> # in later model fitting. Note there is
> # no need to load the data before hand.
>
> setSymbolLookup(SPY='yahoo',
+ VXN=list(name='^VIX',src='yahoo'))
>
> mm <- specifyModel(Next(OpCl(SPY)) ~ OpCl(SPY) + Cl(VIX))
>
> modelData(mm)
mm is now a quantmod object holding the model formula and data structure implying the next (Next) period's open to close of the S&P 500 ETF (OpCl(SPY)) is modelled as a fucntion of the current period open to close and the current close of the VIX (Cl(VIX)).
The call to modelData extracts the relevant data set, with transforms magically applied. You can take the data and do with it as you'd like. A more direct function to accomplish the same end is buildData.
What's next?
How about some examples of quantmod's data handling